
Published · By Henry Palma
What Is Market Risk? Trading Book, AOCI, VaR & FRTB Explained
Market risk is losses when prices move. See where it hides at a regional bank, why AFS bond losses hit equity, and how DV01, VaR and FRTB measure it.

Market risk is the risk of losses when market prices move: interest rates, credit spreads, currencies, stocks and commodities. At most regional banks, the biggest market risk is not the trading desk. It is the bond portfolio. In this post, we use a fictional regional bank, Ridgeway Regional Bank, to show where market risk hides, how it is measured, and which US rules apply as of November 2026. All Ridgeway numbers are illustrative.
A Monday-morning surprise
Interest rates rose one percentage point. Ridgeway sold nothing. Nobody defaulted. But the bond portfolio is down $81 million, and the loss shows up in shareholders' equity. That is market risk.
The five big drivers
Market risk comes from five kinds of price moves:
- Interest rates. When rates go up, bond prices go down.
- Credit spreads. The extra yield investors demand to hold riskier bonds.
- FX, or foreign exchange. Currency prices.
- Equity. Stock prices.
- Commodities. Oil, metals and crops.
Meet Ridgeway Regional Bank
Ridgeway is fictional and used for teaching. It has about $9 billion in assets. It holds $1.8 billion of bonds as available-for-sale, or AFS: bonds it may sell before they mature. It runs a small customer desk for swaps, FX and bonds, with $400 million of trading assets and liabilities. And it is not covered by the US market risk capital rule. We will see why below.
Trading book vs. banking book
Banks keep two books, and the same rate move lands in different places.
- Trading book. Positions you plan to sell soon, or that hedge what you sell. They are marked to market every day, so gains and losses hit earnings right away.
- Banking book. Loans, deposits and investment bonds. Price moves on AFS bonds go to AOCI, accumulated other comprehensive income, which is a part of equity.
Interest rate risk in the banking book, called IRRBB, gets its own episode later in the series.
Where the $81 million came from
A rough rule of thumb: the price change is about the value, times the duration, times the rate move. Duration, in plain words, is how much a bond's price moves for a one-point change in rates.
Ridgeway's AFS bonds are worth $1.8 billion, with a duration of 4.5 years. That means the price drops about 4.5% for each one-point rise in rates. Rates rose 1%, so:
$1.8 billion × 4.5 × 1% ≈ $81 million
The loss goes to AOCI, not earnings. But it is real.
This really happened: 2022 to 2026
- In March 2022, the Federal Reserve started raising rates from near zero, and bond prices fell hard.
- In March 2023, Silicon Valley Bank, or SVB, sold AFS bonds and took a loss of about $1.8 billion. Our liquidity risk video shows how that ended.
- By July 2023, the Fed's target range was 5.25% to 5.5%.
- As of June 30, 2026, FDIC-insured banks still had $326.7 billion of unrealized losses on their securities, according to the FDIC, the Federal Deposit Insurance Corporation.
The lesson: unrealized doesn't mean unreal.
Do AFS losses hit capital?
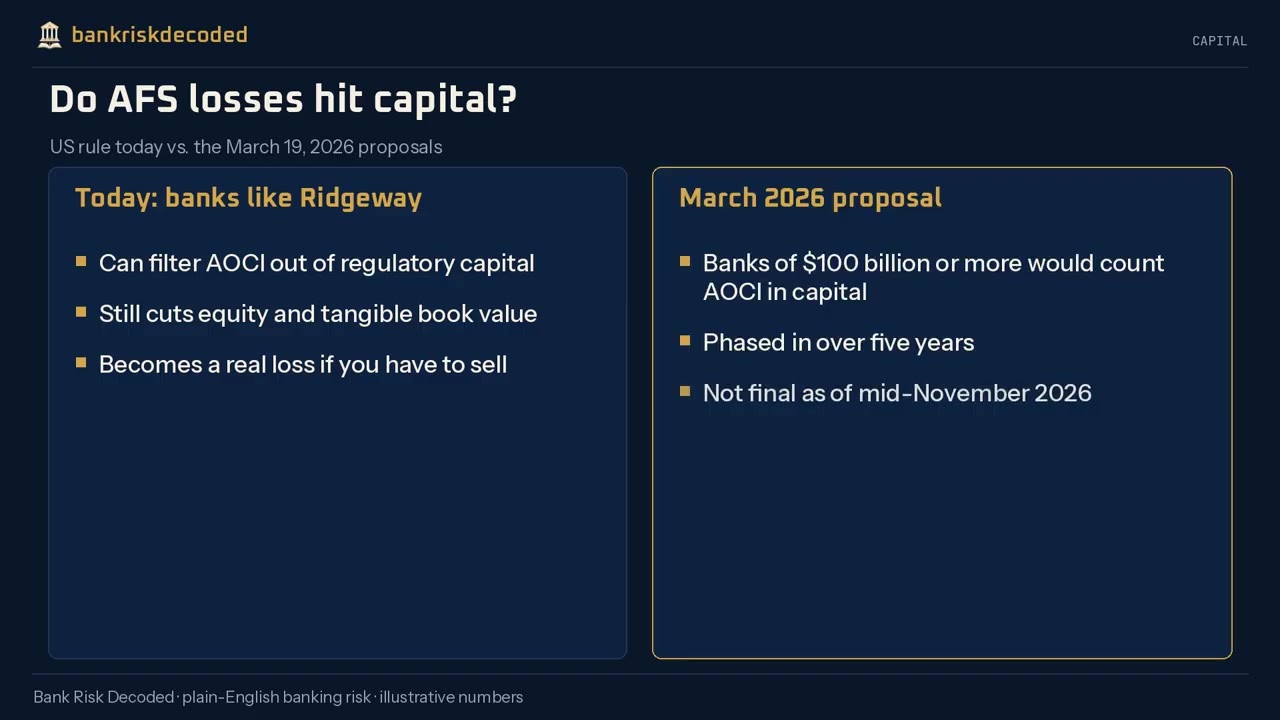
Today, banks Ridgeway's size can choose to filter AOCI out of regulatory capital. But the loss still cuts equity and tangible book value, and it becomes a realized loss if the bank ever has to sell.
Under proposals from March 19, 2026, banks with $100 billion or more in assets would have to count AOCI in capital, phased in over five years. As of mid-November 2026, that is still a proposal.
How market risk is measured
Sensitivities and DV01
Start with sensitivities. The most common is DV01, the dollar value of a one basis point move. One basis point is one hundredth of a percent.
Ridgeway's trading book has a DV01 of $25,000. Its AFS bonds have a DV01 of $810,000. So a 10 basis point rise costs about $8.35 million, almost all of it in the bond portfolio.
VaR, value at risk
Sensitivities don't add up into one number. VaR does. Ridgeway's one-day VaR at 99% is $600,000. In plain words, on 99 trading days out of 100, the desk shouldn't lose more than $600,000. So you should expect two or three worse days a year. Our VaR video covers it in depth.
Stressed VaR and expected shortfall
VaR has a blind spot: it tells you where the bad days start, not how bad they get. There are two fixes.
- Stressed VaR runs the same portfolio through a 12-month crisis period, like 2008. For Ridgeway, that is $1.5 million.
- Expected shortfall, or ES, is the average loss on the worst 2.5% of days. For Ridgeway, $750,000. On a perfect bell curve, ES at 97.5% is about the same as VaR at 99%. Real markets have fatter tails, so ES comes out higher.
Stress tests
VaR leans on recent history. Stress tests ask what history hasn't shown yet. For Ridgeway:
- If rates rise 2%, the AFS bonds lose about $162 million.
- If credit spreads widen one point on $300 million of corporate and municipal bonds, that is about $15 million.
- If the dollar moves 10% against $20 million of unhedged customer FX, about $2 million.
The bond portfolio dominates. Our stress testing video goes deeper.
How the rules evolved
- January 1996: Basel let banks use VaR models for capital: 99%, ten days, times three.
- July 2009: after big trading losses in the 2008 crisis, Basel 2.5 added stressed VaR.
- 2016, revised 2019: FRTB, the Fundamental Review of the Trading Book, replaced VaR with expected shortfall at 97.5%.
- January 2023: Basel's global start date for the new framework.
The spirit: measure the bad days, not the average ones.
Who is covered in the US today
The US market risk rule applies when trading assets plus trading liabilities reach $1 billion, or 10% of total assets. Ridgeway's desk is $400 million, about 4.4% of assets. That is below both tests, so it is not covered. Supervisors can still apply the rule if the risk warrants it.
The capital math, if Ridgeway were covered
The rule uses a ten-day VaR. Scaling by the square root of ten, Ridgeway's VaR is about $1.9 million, and its stressed VaR is about $4.7 million.
Capital is about three times the average VaR, plus three times the average stressed VaR:
3 × $1.9M + 3 × $4.7M ≈ $19.8 million
That three can rise toward four if real losses beat VaR more than four times in 250 days. Checking this is called backtesting. Multiply capital by 12.5 to get risk-weighted assets, or RWA: about $248 million.
FRTB in the US: November 2026
Today, covered banks use VaR plus stressed VaR, with a trading test of $1 billion, or 10% of assets.
On March 19, 2026, regulators proposed an FRTB-style framework: expected shortfall for models, and a new standardized approach built on sensitivities. The size test would rise from $1 billion to $5 billion, averaged over four quarters, and the 10% test stays. As of mid-November 2026, it is still a proposal. Our FRTB video covers the framework itself.
Limits and governance
Measuring isn't enough. You need limits and governance:
- The board sets the risk appetite: how much loss is acceptable.
- ALCO, the asset-liability committee, and the risk committee watch it.
- Each desk gets limits: DV01, VaR, stop-loss and position size.
- An independent risk team prices the positions and backtests VaR.
- Breaches escalate fast, with a plan to fix them.
Five common market risk mistakes
- Thinking market risk is only the trading desk's problem.
- Ignoring AFS losses because they are unrealized.
- Trusting a VaR built on calm years.
- Hedges that don't really match. That is basis risk.
- Limits nobody watches, or nobody updates.
Five questions to ask your team
- What is our DV01, in the bond portfolio and on the desk?
- What would a 2% rate rise do to AOCI?
- What is our VaR, and how often was it beaten?
- Which limits were breached this quarter?
- Are we anywhere near the trading tests: $1 billion, or 10% of assets?
Key takeaways
- Market risk is losses when prices move: rates, credit spreads, FX, equity and commodities.
- At a regional bank, the bond portfolio is usually the biggest exposure, not the trading desk.
- Value × duration × rate move is a quick estimate: for Ridgeway, a 1% rise costs about $81 million in AOCI.
- Measure it with DV01, VaR, stressed VaR, expected shortfall and stress tests.
- The US capital rule starts at $1 billion of trading, or 10% of assets; a March 2026 proposal would raise the test to $5 billion, and it is not final.
- Unrealized doesn't mean unreal: AFS losses still cut equity and become real if you sell.
Check your understanding
1. Rates rise one percentage point. A bank holds $1.8 billion of AFS bonds with a duration of 4.5 years. Using the rule of thumb, what is the approximate loss?
- A. $18 million
- B. $45 million
- C. $81 million
- D. $180 million
2. Where do price changes on available-for-sale (AFS) bonds go?
- A. Straight to net income every day
- B. AOCI, accumulated other comprehensive income, a part of equity
- C. Nowhere, until the bonds mature
- D. Only into the trading book's VaR
3. What does DV01 measure?
- A. The loss on the worst 1% of days
- B. The dollar value of a one basis point move
- C. The average loss on the worst 2.5% of days
- D. The capital multiplier after backtesting
4. When does the US market risk capital rule apply today?
- A. When total assets exceed $9 billion
- B. When trading assets plus liabilities reach $5 billion
- C. When trading assets plus liabilities reach $1 billion, or 10% of total assets
- D. At every bank that holds AFS bonds
5. What does expected shortfall (ES) tell you that VaR does not?
- A. How bad losses get on the worst days, on average
- B. Where the bad days start
- C. The dollar value of a one basis point move
- D. How many trades the desk made
Answer key
- C. $1.8 billion × 4.5 × 1% ≈ $81 million.
- B. AFS price moves go to AOCI, a part of equity, not earnings.
- B. DV01 is the dollar value of a one basis point (0.01%) move.
- C. The rule kicks in at $1 billion of trading assets plus liabilities, or 10% of total assets.
- A. VaR shows where bad days start; ES averages the losses beyond that point.